AQI

To View the Current PM2.5 reading - Ban Ruammit or Pa O use the links below.

Ruammit area (Ambient Weather sensor) Click here
Pa O area (Ambient Weather sensor ) Click here

If no AQI data is visible the AQI sensor is not transmitting at this time.
Historical data can be viewed on the dashboard by clicking on the graph mode icon Graph

PM 2.5 Levels

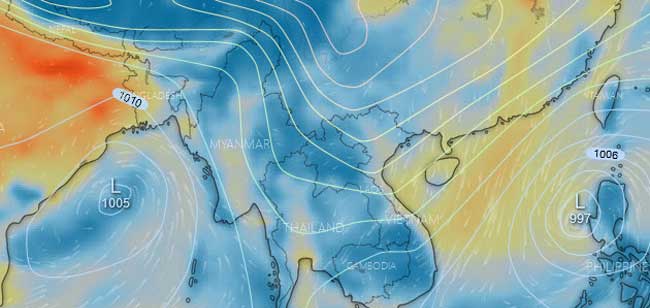
Air Quality (PM 2.5) in South East Asia - from Windy.com

windy.com is an external site.

Displays current and forecast PM2.5 levels together with atmospheric pressure

High pressure to the north can cause PM 2.5 levels to increase when air is pushed down from China

Fire Map - NASA | LANCE | FIRMS

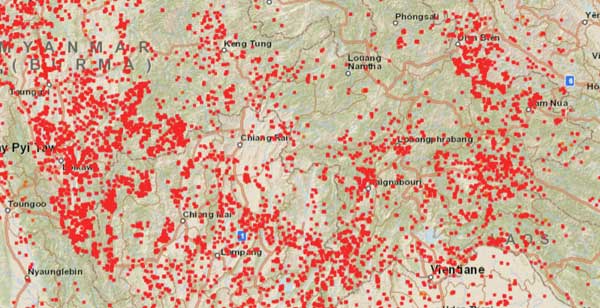
Fire Mapper ( FIRMS ) South East Asia - source NASA

eosdis.nasa.gov is an external site.

Displays current fires over last 24 hours and can be configured to show different time periods and other parameters.

Note: You should check and/or adjust the date that selects data for display.

NASA | EOSDIS Worldview

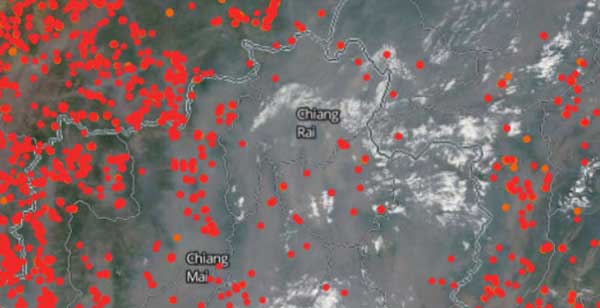
EOSDIS World view satellite image South East Asia - source NASA

worldview.earthdata.nasa.gov is an external site.

The image shows smoke drift, cloud cover and fires and can display historical data

Important:

You must check and/or configure the date in the lower left corner each time of use.

Satellite Map

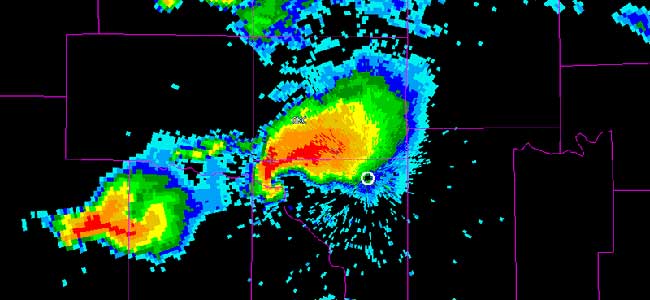
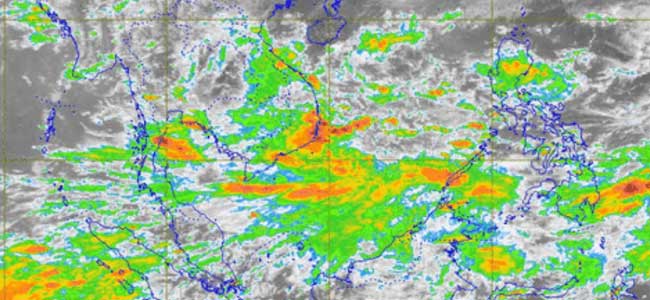
Rain Radar from Thai Met Department (TMD)

Satellite Map

Thai Met Department (TMD)
Satellite Map
External site - opens in a new tab

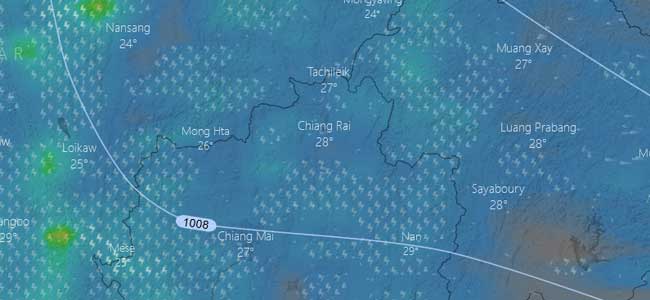
Windy.com Rain

Windy.com rain and thunder forecast
External site - opens in a new tab

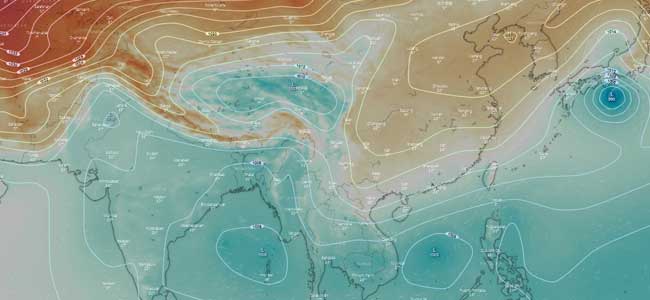
Atmospheric pressure ( isobar)

Windy.com  -  Atmospheric pressure.
In Oct/Nov as the pressure in China increases, the cold air tends to creep down to Northern Thailand and can affect PM 2.5 levels
External site - opens in a new tab